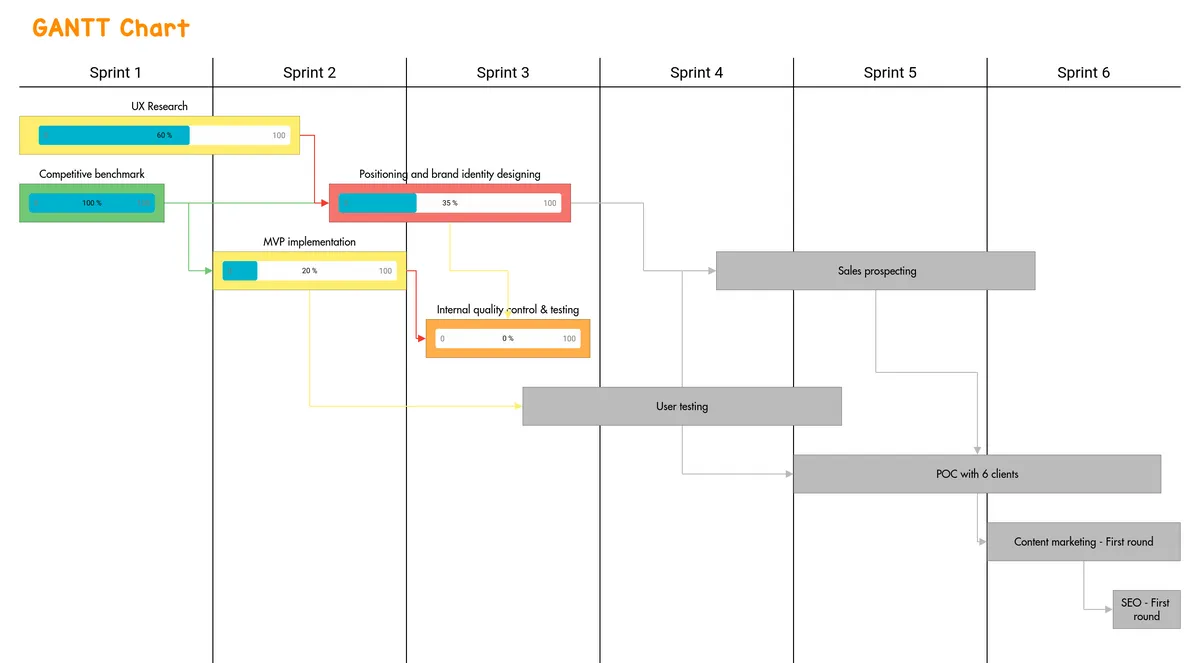
What is a Gantt Chart?
A Gantt Chart is a planning tool that visualizes the logical sequence of a project’s tasks, from start to finish, over a set period of time. Additionally, it highlights dependencies between tasks or potential bottlenecks that could delay a project’s on-time completion.
- The vertical axis divides a project sequentially into stages, including the individual tasks that make up each of those stages.
- The horizontal axis represents time—expressed in hours, days, weeks, or months depending on the project’s duration.
The end result of a Gantt Chart is simple: It provides a clear schematic for how a project should theoretically unfold over time, as long as everything goes according to plan and all dependencies are accounted for in a timely manner.
Why are Gantt Charts powerful tools?
For starters, a Gantt chart visually represents the totality of a project—and all of its individual components (tasks)—in full detail across a specified period of time. This helps key project stakeholders know exactly when they must start and finish individual tasks in order to make progress towards full project completion. Measuring a project’s total duration is as simple as calculating the time span between the start of the first task and the end of the last task.
Knowing that over the course of any project some tasks will be linked while others will overlap, a Gantt Chart can come to the rescue by clearly identifying where dependencies exist, where there may be executional risks, and what a realistic timeline might look like.
It’s important to note, however, that nothing in a Gantt Chart is set in stone. You can add in new tasks—or even sub-tasks—at any time and adjust the entire schedule based on new dependencies or unexpected constraints. Consider it a “living” document.
And although many teams use Gantt Charts for planning purposes, it can also be used to monitor a project’s progress over time. In the event of a delay, the tool helps teams understand the total impact of that delay on both the task and project level. This is critical for adjusting plans and reallocating resources accordingly.
How to build a Gantt Chart
Here are the basic steps to follow to build an effective Gantt Chart:
Step 1: Define project stages and tasks
Start by determining the full scope of the project, including the initial start and end dates.
Then break the project up into “broad strokes” stages or phases that flow in a chronological order. You don’t need to go into too much detail here. The goal is to identify the key milestones, whether deliverables or stakeholder check-ins, that mark the end of each stage and allow the project to progress onto the next stage.
Finally, break each stage into the individual tasks, in chronological order, that need to be completed in order to reach the desired milestone. For example, if one of the tasks includes “hiring an employee,” then its linked sub-tasks might include: “publish a job description,” “make a short list of candidates,” “interview candidates,” and “extend an offer.”
Step 2: Estimate the duration of each task
Now, it’s time to break each task into units of time. This can be expressed in hours, days, weeks, or months. Be sure to note any constraints that might affect these tasks from being completed on-time, including human resources on leave, availability of certain materials or equipment, or even latency time.
Step 3: Identify dependencies between tasks
In any project, there’s a good chance some tasks will be linked to each other in some way, shape, or form. Dependencies can actually take on many forms, including:
- Finish to Finish (FF): Tasks must be completed at the same time.
- Finish to Start (FS): One task must be completed in order for the next task to start.
- Start to Finish (SF): One task cannot be completed until another task has started.
- Start to Start (SS): One task cannot be started until another task has started.
Step 4: Build your Gantt Chart
Start by lining up all stages—and the tasks that fall within them—in descending order along the vertical access (the left-most column) until you’ve captured all tasks from start to finish.
Then draw vertical lines representing your chosen increments of time. If you choose weeks as your time unit, you’d label your columns along the horizontal access as “Week 1,” “Week 2,” “Week 3,” and so on.
Finally, it’s just a matter of visualizing each task’s duration by creating a colored bar that stretches horizontally from the task’s proposed start date to its estimated end date.
As you build your Gantt Chart, you may want to include these additional elements:
- Dependencies between tasks
- Task completion rate (represented as a percentage)
- Key milestones (deliverables or otherwise) at the end of each stage
- Human resources responsible for completing each task
- Stakeholders responsible for validating each stage or task
- Financial or material resources required for completing each stage or task
Step 5: Stay on top of project progress
Is the project moving along on schedule? Will it be completed on time? Are there any roadblocks getting in the way? Your Gantt Chart can answer all of these questions—and many more—to help you get a better grasp of your project’s real-time progress.